Motivation Link to heading
For generating architecture diagrams I use Lucid Charts free version. Issues I have faced with lucidcharts are the following;
- AWS shapes are not loaded initially when creating blank diagram
- Shape and arrow organization are not consistent for me
- Exporting architecture diagram is manual process
I found this nifty python library called diagrams where I can use code to construct my architecture diagrams and solve my issues I am facing with Lucidcharts.
Steps Link to heading
Here is a personal repo where I use python diagrams.
Here is snippet of how I created a diagram for a File manager API workload in AWS
| |
Here is the diagram generated from the snippet above
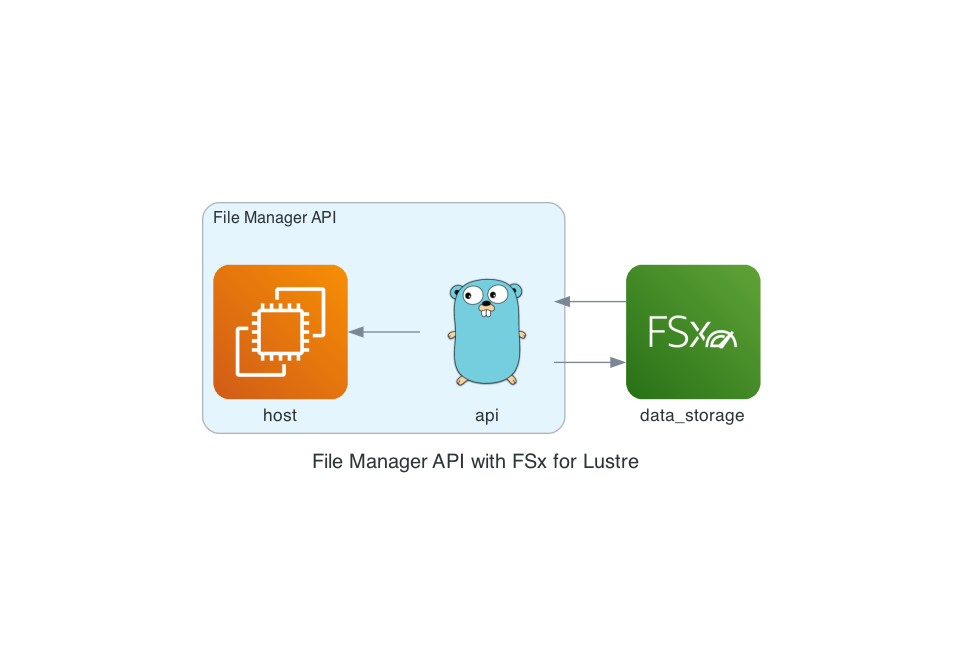
As you can see icons, shapes and arrows are organized correctly. Titles and icon names are aligned together.
Diagrams has support for a majority of services like;
Takeways Link to heading
I will definitely use diagrams in my day-to-day programming activities to create architecture diagrams for my workloads.
I will be exploring cookiecutter templates to generate architecture diagrams for the following usecases;
- Event processing pipeline
- Production kuberentes workloads
- AWS Serverless API workload
- EC2 hosted application
I will also explore devbox so that I have diagrams tooling in every terminal and editor session to be able to generate diagrams for my personal and work projects.